

When looking at data, and data summaries, we tend to focus on count data. There were three (3) positive tests. There were ten (10) customer complaints. There were two (2) incidents last month. Counts feel concrete, intuitive and easy to compare, so they often become the first, and sometimes the only, numbers we look at.
But counts alone rarely tell the full story…
A count tells us that something happened, not
- how often it happens,
- how likely it is, or
- how meaningful it is relative to the system it came from.
Without additional context, the same count can represent very different things.
A count is not a comparison. A count is simply a tally. It answers the question “how many,” but not “out of how many.” Three positive tests may sound alarming, reassuring or irrelevant depending on whether they came from ten tests, a hundred tests or ten thousand tests. This is where the denominator becomes critical. The denominator defines the scale of the measurement and provides the context needed to interpret whether a count is large, small within range or unusual.
So how do we make comparisons possible? Normalization! Normalization is the step that turns a count into something that can be meaningfully compared. It involves dividing the count by a denominator that reflects the scale that we are interested in.
Common examples include:
- Positives per total tests (emphasizing detection likelihood)
- Incidents per month (emphasizes trends)
- Findings per unit area (emphasizes spatial intensity)
- Events per unit time (emphasizes trends)
Once normalized, data from systems of different sizes can be compared. Differences are no longer driven by how big the system is, but by how it behaves.
Counts Over Time Can Be Especially Misleading
Counts are often tracked over time to assess changes (improvements or declines in performance). However, counting overtime can reflect many changes at once: growth, increased monitoring, seasonal activity or changes in reporting practices.
An increase in total events does not necessarily indicate worsening conditions. It may simply indicate that the system has grown or that monitoring has become more intensive.
Rates help separate true changes in behavior from changes in scale. A stable rate with rising counts often signals expansion rather than increased risk. Without normalization, time trends based on counts alone are difficult to interpret reliably.
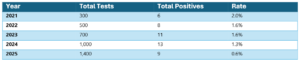
Example: Imagine the following example, where we track environmental monitoring results for a single facility over multiple years. The goal is to evaluate performance over time.
At first glance, there are two obvious ways to make this comparison:
- Compare the total number of positive results each year
- Compare the positivity rate, defined as positives per total tests performed
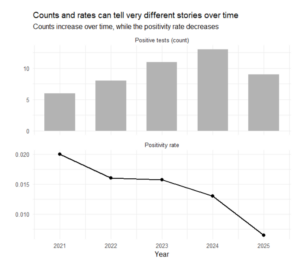
If we focus only on the first option, the conclusion seems straightforward. In 2024, the facility recorded the highest number of positive results. Based on counts alone, it would be tempting to conclude that 2024 was the worst-performing year.
But this conclusion is incomplete.
When we examine the second option, the context changes. The number of tests conducted increased substantially over time, particularly in 2024 and 2025. The increase in total positives coincided with a much larger increase in monitoring effort.
Once results are normalized by the number of tests conducted, performance looks very different. The positivity rate steadily declines, indicating improved performance despite higher total counts.
Conclusion. Counts tell us that something happened. Denominators tell us what it means. Counts are essential for planning, resourcing and understanding operational demand. But when used for comparison without normalization, counts can mislead more than they inform. Larger systems, more transparent systems and systems that monitor more intensively will almost always appear worse when judged by counts alone. Meaningful comparisons require context. Context comes from the denominator. Understanding why counts cannot be used for comparisons, and why the denominator matters, is a foundational step toward responsible, fair and effective use of data.