

In today’s data-driven world, analyzing and learning from data is essential for effective decision-making. However, one of the biggest challenges in data analysis is how the data is organized. Poorly structured or unclean data makes analysis difficult, requiring significant time, effort and expertise to clean and format it for meaningful insights. The cleaner your data is from the start, the less work is needed on the back end. Investing just one hour in organizing your data collection upfront can save you an entire day of data cleaning later—making early planning a crucial step in any data-driven project.
What is clean data?
Clean data refers to datasets that are structured and formatted correctly, and free of errors and inconsistencies (or at least they try to minimize them). Clean data is a lot more useful for analysis and decision-making as it eliminates anomalies and sets the data in the correct format for analysis without the need for data cleaning.
So why should you care about clean data?
- Time – clean data saves you time by reducing the need for data cleaning
- Barrier of entry to analysis – the cleaner your data the easier it is to analyze it, meaning that you do not need an expert data engineer to clean your data.
- Allows you to notice inconsistencies and reduce errors – data in a clean format will allow you to notice inconsistencies quicker and, at the same time, reduce entry errors.
Data Structure
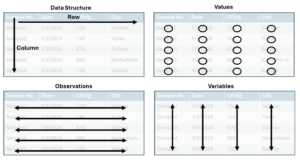
The first concept of clean data is data structure. Datasets are often tables made from columns (top to bottom) and rows (left to right). Within a dataset, we will have three main components, described below and illustrated in Figure 1.
- Value: the specific data point recorded for a variable in an observation. It represents the actual measurement or attribute associated with an entity.
- Observations: is a single instance or record in a dataset, it contains values for each variable in the dataset. Observations represent the actual data collected from a unique entity or event.
- In produce testing, an observation would be an individual sample.
- Variables: is a characteristic, property or attribute that is measured or recorded in the dataset. Variables define what kind of information is being collected and can take on different values across observations.
- Examples of variables include date, result (numeric or categorical), temperature, location, etc.)
Now that we have a clear understanding of values, observations and variables, we can focus on how to structure them properly in a clean dataset:
- Rows represent observations – Each row corresponds to a single record or instance in the dataset.
- Columns represent variables – Each column contains a specific characteristic or attribute measured across all observations.
Figure 1: Data structure of clean data
Values: best practices to minimize errors and inconsistencies
Now that we know how to structure our dataset in a clean format. We need to think about our individual values. If the values within the dataset are messy, it does not matter if we have a good structure, the data will be nearly impossible to analyze without some data-cleaning magic.
Below we have identified some best practices for you to minimize errors and avoid inconsistencies in your data for different data types:
Categorical Data:
Definition: Represent discrete groups or categories that classify observation without any inherent numerical meaning. These can be names, labels or predefined groups.
Examples: city names, results (positive and negative), county, water type (Type A, or Type B).
- Standardize categories: Use predefined lists or dropdown menus to avoid inconsistencies.
- e.g., to avoid situations like “CA” vs. “California” vs. “Cali”.
- Avoid free text input: Use controlled vocabularies or predefined options from a dropdown menu.
- Be case-insensitive: Convert all values to lowercase or uppercase to prevent mismatches
- e.g., “SALINAS” vs. “Salinas”.
- Handle missing values appropriately: Use a designated “Unknown” or “N/A” category instead of leaving blanks.
Numerical Data:
Definition: Numerical data represents measurable quantities and can be used in mathematical calculations.
Examples: Results (CFU/g or MPN/100 mL), Temperature, Distance, Precipitation amount.
- Ensure numerical consistency: Store numbers in a standardized format and units
- Temperature in Fahrenheit or Celsius (use one only) or Distance in meters vs inches.
- Define numerical validation rules
- Microbiological quantitative results cannot be negative
- Avoid leading zeros for integers: Example: “007” should be “7” unless it’s an identifier (which would make it a categorical variable).
Date and Time Data:
Definitions: Date and time data records temporal information such as timestamps, event dates and durations. It is used for time-based analysis, scheduling and trend detection.
Example: Sample collection date.
- Use a standard date format
- 2025-02-20 vs 02/20/2025
- Time: Ensure consistent time format and avoid mixing 12-hour (AM/PM) and 24-hour formats.
Boolean Data:
Definitions: Boolean data represents binary values that indicate the presence or absence of a condition. It is often used in logical operations and decision-making processes.
Examples: True/False, Yes/No, 1/0
- Use a consistent format: Stick to one representation (TRUE/FALSE, YES/NO, or 1/0 but not a mix).
Free Text:
Definition: Free-text fields contain unstructured text data where users can enter information freely. This type of data is used for comments, descriptions, and open-ended responses.
- Limit text input length: Prevent excessive text
- Standardize capitalization: Use proper case for names, and cities (e.g., “Salinas” vs “salinas”).
- Remove unnecessary spaces: Trim leading and trailing spaces.
Examples of a well-structured dataset vs a not well-structured dataset
Well Structured Dataset:
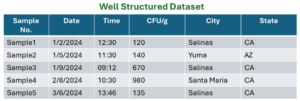
- Each row represents a unique observation (Sample).
- Each column represents a single variable (Date, time, CFU/g, City, State)
- Data is formatted consistently (numbers, text and categorical values are in proper fields).
- No duplicate or missing values.
Poorly Structured Dataset:
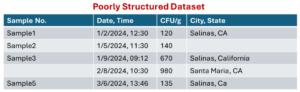
- Inconsistent formatting – “Date, Time” and “City, State” are combined in one column instead of separate ones.
- Missing values – Sample 4 is blank.
- Inconsistent text formatting – “California” vs. “CA” vs. “CA” (mixed formats for state).
Issues and Solutions:
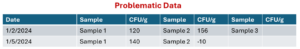
- Multiple Variables in One Row – Each row contains multiple samples instead of following a tidy format where each row should represent a single observation.
- Repeating Column Headers (Sample, CFU/g) – The same column names (Sample, CFU/g) are repeated, making the dataset harder to analyze systematically.
- Inconsistent Data Alignment – Some data points (e.g., “Sample 3”) do not have corresponding values for CFU/g.
- Negative CFU/g Value – The value -10 under CFU/g is not valid because colony-forming units (CFU) should always be non-negative.
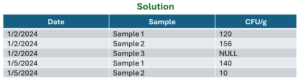
- Each row represents a single observation (i.e., one date-sample-CFU/g entry).
- No repeated column names – Each variable has its own distinct column.
- Eliminates missing/ambiguous values – If a sample has no CFU/g, it is explicitly recorded as NULL.
- Data validation enforced – CFU/g values are checked to be non-negative.