

It has been a while since the last Data 101 episode; things have been busy!
For this new post, I want to break down one of the most common (and commonly misunderstood) concepts in data analysis:
- statistical significance,
- p-values,
- And the basic idea behind hypothesis testing
What is Statistical Significance?
Statistical significance is a way to determine whether the patterns we observe in data are likely to be real or could have happened by random chance. If something is significant, we are likely to observe that same pattern as we collect more data or conduct additional trials.

Hypothesis Testing
Now that we know what statistical significance means, the next question is: significant compared to what?
To decide whether an observed difference is meaningful, we compare it against a scenario where nothing is happening or expected to be different.
We do this by defining two hypotheses, one that assumes nothing is happening, and one that represents that there is a change. We call these null hypotheses and alternative hypotheses.
- Null Hypothesis (H₀): The assumption that there is no difference, change, or effect.
- Alternative Hypothesis (H₁): There is a difference, change or effect that might be true.
Example: Comparing Water Quality Between Two Months
Suppose you want to evaluate whether Generic E. coli levels in your canal water are on average different in July compared to August.
- H₀: The average Generic E. coli levels in July and August are the same.
- H₁: The average Generic E. coli levels in July and August are different.
Most significance tests: t-tests, ANOVA, non-parametric tests, etc., follow this exact logic. The specifics change depending on the test, but the basic structure remains the same. Sometimes you test for any difference (a two-sided test), and sometimes you test for a difference in a specific direction one is greater or lower than the other, (one-sided test), but the basic structure remains the same.
What is p-value?
Once you define your hypotheses, you need to determine whether the data support the null or the alternative. The p-value helps answer this.
Think of p-value this way:
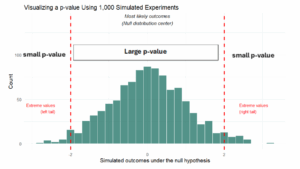
When thinking about p-values, imagine running an experiment 1,000 times (where you pick numbers close to 0, but can go up to -3 or 3). Most outcomes would fall within a common, expected range, but occasionally you’d see more extreme results purely due to chance. If your observed result falls in the range of outcomes that occur frequently when nothing is happening, the p-value will be large. If your result lands in the extreme tail, something that only happens in a small percentage of those 1,000 repetitions, the p-value will be small.
The plot below illustrates this idea. Each green bar represents how frequently different outcomes occurred across 1,000 simulated experiments where the null hypothesis is true. Notice how:
- Most of the simulated outcomes cluster around the center (near 0), this region represents the “most likely outcomes”, the kinds of results we would expect to see repeatedly if nothing meaningful is happening.
- The two red dashed lines represent the extremes: Anything beyond these cutoffs falls into the “extreme tails.” These are the values that occur rarely when the null hypothesis is true (everything is the same).
- The tails represent the p-value area: The p-value is simply the proportion of all simulated outcomes that fell as far out into the tails as our observed result
If only a small fraction of outcome land in these extreme regions, then our observed value is considered unlikely under the null hypothesis, this is what we call a statistically significant result.
Applying This to our Water-Quality Example
Again: Imagine you are evaluating a well or surface water source and want to know whether generic E. coli levels in August are different than in July. If they are different, you will evaluate and apply management practices accordingly
Your hypotheses would look like:
- H₀: The average Generic E. coli levels in July and August are the same.
- H₁: The average Generic E. coli levels in June and August are different.
After running the test, you would interpret the p-value:
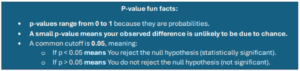
- If p < 0.05, you would typically say the difference is statistically significant and reject the null hypothesis.
- If p ≥ 0.05, you fail to reject the null hypothesis, meaning the evidence is not strong enough to conclude a difference exists.
Failing to reject the null does NOT mean the levels are the same, it only means your data did not provide strong enough evidence of a difference.