

Staying informed about production trends, economic information and food safety is extremely important for grower operations. Data analysis helps in making informed decisions regarding farm management, production and food safety. This article highlights three resources that provide valuable insights into trends in the produce world and food safety: the Census of Agriculture, along with the U.S. Department of Agriculture (USDA) Economic Research Service
(ERS) Yearbook Tables and the U.S. Food and Drug Administration (FDA) Data Dashboard.
Census of Agriculture: Comprehensive Agricultural Data
Every five years, the USDA conducts The Census of Agriculture. The Census of Agriculture offers extensive data and statistics related to land use, production practices, income and expenditures. The 2022 Census of Agriculture was released in March of this year (2024). Some key takeaways from this year’s census include California accounting for 68 percent of the value of fruits, tree nuts and berries and 41 percent of the value of vegetables. In 2022, 74.6 percent of the lettuce area harvested was in California and 17.7 percent of the lettuce area harvested was in Arizona, totaling 92.3 percent of lettuce area harvested in the U.S. Similarly, area harvested from multiple Census reports can be used to look at production trends of cantaloupes per state. See Figure 1 as an example as a plot for the top 10 states by cantaloupe area harvested, where California and Arizona have consistently been the top two producing states.
USDA ERS Yearbook Tables: Production and Trade Data
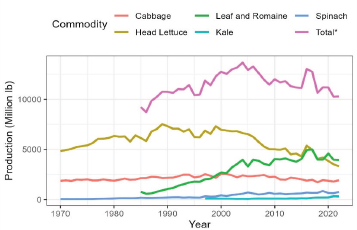
The USDA Economic Research Service develops yearbook tables for fruits, tree nuts, vegetables and pulses. These yearbook tables can be used to develop timeseries of annual production, prices, trade use and more for all these different commodities. Analysis of this data can allow growers to understand trends and help assess production plans for upcoming years.
For fruit and tree nuts, click here.
For vegetables and pulses, click here.
We can use this data to see production trends of multiple leafy green commodities. See example in Figure 2. We can see that Leaf and Romaine lettuce production has taken off since the 1990s, while head lettuce production has seen a decline since the 2000s.
FDA-Data Dashboard – Recall Data:
The FDA Recalls Data Dashboard is a valuable resource for staying updated on food safety issues. This dashboard provides detailed information on recent recalls, including the reasons for the recall, affected products and the steps being taken to address the issue. By monitoring recall information, growers can proactively address potential safety issues, implement corrective actions and enhance their food safety protocols.
The dashboard offers a historical perspective on food safety recalls, allowing growers to analyze trends and identify common safety issues. This information is critical for understanding the potential risks associated with specific crops or production practices. Staying informed about recalls helps protect consumers and maintain the integrity of produce, ensuring that only safe and high-quality products reach the market.
You can access the dashboard and recall data here.
Access to reliable data is essential to understand production trends and ensure food safety. While there are thousands of other resources, The Census of Agriculture, the USDA ERS Specialty Crops Table and the FDA Recalls Data Dashboard are resources that can provide data, answers and guide data-based decisions.