

Last week, the Western Growers Science staff had the opportunity to present on GreenLink® during the Western Food Safety Conference. The presentation focused on how data science is transforming produce food safety and how GreenLink® is helping the industry move from compliance snapshots toward a more practical, data-driven food safety culture.
For me, developing this presentation was also a good moment to reflect, as I presented many of the concepts that will be highlighted below.
I have now been working on GreenLink® and food safety data sharing for about 30 months. During that time, I have had the opportunity to work with you, the LGMAs, and researchers, and many others across the produce safety community. I have learned a lot about data management, analytics, and data communication. But more importantly, I have learned that successful data programs are not really about technology first. They are about people, trust, context, and the ability to turn information into action.
GreenLink® was built around a simple but important idea: the produce industry already generates a tremendous amount of food safety data, but much of that information remains fragmented. Individual datasets can be useful, but when data is structured, protected, aggregated, and interpreted correctly, it can help us see broader patterns, ask better questions, and support smarter risk management decisions.
These are my 3 learnings:
Learning 1: Data quality is key
The first lesson is probably the most obvious, but also the most important: data quality is VERY important.
A phrase I shared during the presentation was: “The quality of your decisions will never exceed the quality of your data.”
In food safety, we often talk about testing results, observations, corrective actions, and verification activities. But the value of all of those data points depends on how consistently and completely they are recorded. The same output and variable can be documented in multiple ways across different organizations, programs, labs, or even individuals within the same company. Site names, sample descriptions, adjacent land conditions, sampling timing, weather, and production context can all vary in how they are captured.
That variability matters.
- Free-text fields may feel flexible, but they can make aggregation and comparison difficult.
- Missing metadata can limit interpretation.
- Two identical test results (Negatives/Positives) can mean very different things depending on timing, environmental conditions, water source, commodity, region, or sampling information.
- Without the right context, data can tell us what happened, but not necessarily why it happened or what should be done next.
One of the biggest lessons from GreenLink® is that data quality is not just a data problem. It is a process problem. Even well-trained teams can produce inconsistent data if the process does not support them. For our work with GreenLink®, this has meant focusing not only on collecting data, but also on identifying which parameters matter, building better submission systems, creating verification steps, and working toward higher completion and consistency across key data fields. The goal is not just to have more data. The goal is to have usable data.
For more information on data quality you can access my article on clean data: https://www.wga.com/news/data-101-is-your-data-dirty/
Learning 2: Data governance builds trust, and trust drives participation
The second lesson is that data programs succeed when people trust how their data will be used.
This is especially important in food safety. The data we are discussing can be sensitive. It may relate to pathogen testing or practices that companies do not want to be used out of context. That concern is real, and it has been respected.
One thing I have learned from working with many of you is that hesitation around data sharing is often not because people do not see the value. Most people understand the potential. The hesitation usually comes from uncertainty: Who will see the data? How will it be used? Will it be de-identified? Will individual companies be exposed? Will the findings be communicated correctly?
That is where data governance becomes essential. Data governance is the structure that allows participation to happen, it defines how data is protected, how it is aggregated, who has access, what level of information can be displayed, and how results should be interpreted. Concepts like de-identification, anonymization, aggregation thresholds, and role-based access are not just technical details. They are trust-building tools.
But governance alone is not enough. Communication also matters. Through GreenLink®, we have seen how important regular communication is. Participant meetings, interpretation of findings, and direct conversations help reduce misunderstanding. It is not enough to show a dashboard or send a summary. We have to explain what the data means, what it does not mean, and how it can be used responsibly.
Relationships drive participation more than tools do. The technology matters, but people participate when they believe the program is being managed responsibly, when they understand the value, and when they feel that their data is protected. Trust is not built once. It is built over time through transparency, consistency, and continued engagement.
Learning 3: Data analytics evolves from descriptive to predictive to prescriptive, and it is here.
The third lesson is that analytics is a process.
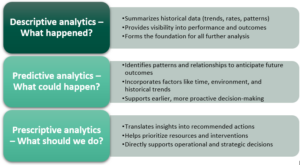
Many data programs begin with descriptive analytics. That means answering the question: What happened? This is where dashboards, summaries, trends, rates, and historical comparisons are useful. Descriptive analytics gives visibility. It helps us understand performance, identify gaps, and see patterns that may not be obvious when looking at one record or one event at a time.
The next step is predictive analytics: What could happen? This is where we begin to combine historical data with environmental, operational, and contextual factors. For example, risk may be influenced by adjacency, land cover, nearby operations, water data, wildlife movement, flooding potential, weather, seasonality, or other environmental conditions. When those data streams are brought together, we can begin to identify patterns and relationships that help anticipate future outcomes.
The long-term goal is prescriptive analytics: What should we do? This is where data becomes most actionable. Prescriptive analytics can help prioritize resources, identify where additional verification may be needed, support grower-level forecasting, improve dashboards, and eventually contribute to early warning systems or risk-based management tools.
What this means for the future
After two and a half years of working on GreenLink®, I am more convinced than ever that the produce industry has an opportunity to lead in data-driven food safety. That is where I believe GreenLink® can create real value. The goal is not to collect data for the sake of collecting data. The goal is to help the industry make better decisions, prioritize food safety resources, and support continuous improvement in a measurable way. Over time, data sharing can help us move from reacting to individual findings toward understanding systems, identifying risk patterns, and designing better interventions.