



Last month I wrote about why developing baseline measures is so important. A baseline tells us what normal looks like for a process. But it leaves an obvious follow-up question: once we have a baseline, how do we decide that a new result is different enough to deserve a closer look?
Today I want to take the next step, moving from baselines to signals.
So, what is a signal?
A signal is a pattern in new data that is unlikely to be explained by routine variation alone. That is all. It is not a diagnosis, and it is not a verdict on whether something is safe or unsafe.
Going back to the commute example, a 38-minute drive on a day you usually take 25 to 35 minutes is just noise. A 65-minute drive is a signal. It does not tell you why it happened, only that the day was different enough to ask questions. In produce safety, that is the job of a signal: to tell us where to look first.
A simple tool: the control chart
Last time I mentioned one of the most practical ways to turn a baseline into a signal is the control chart, a tool that came out of manufacturing quality control almost a century ago. The idea is simple. We take results from a stable baseline period, calculate the average and how much the results normally vary, and draw limits around that average (commonly three standard deviations). Then we plot new results against those limits as they come in. NIST has a good overview of control charts and the patterns to look for. Today I want to elaborate a little bit more.
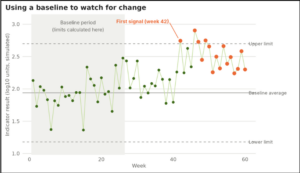
Figure 1 below shows what this looks like using simulated weekly results. The first 26 weeks are the baseline. Later in the series the process shifts upward by a modest amount. Most of the new results still look ordinary, and none of them is dramatic. Yet the chart first flagged a result at week 42, and then kept flagging the weeks that followed, because eight or more results in a row were sitting above the baseline average. That is the pattern of a process that has moved, not of one unlucky week.
A signal is more than one extreme result
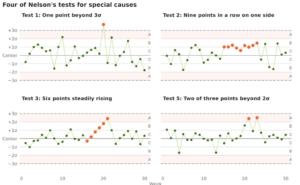
This is the part I think we most often miss. We tend to look for the one big number. But a meaningful change can also show up as a run of results sitting on one side of the average, several results steadily moving in the same direction, or a couple of results hovering close to the limits.
Figure 2 shows four of the tests that Lloyd Nelson described in his 1984 paper, “The Shewhart Control Chart: Tests for Special Causes,” which I accessed here. Nelson divides the space around the average into zones one standard deviation (sigma = σ) wide (C is closest to the average, A is the outer band between two and three standard deviations) and defines each test in terms of those zones. He suggests applying Tests 1 through 4 routinely and adding Tests 5 and 6 when earlier warning is worth a few more follow-ups. The four I picked for the figure are, however in the paper there are 8 total tests that could be applied for us:
Seasonality May Also Matter
Many of the processes we study follow a seasonal pattern. A study of agricultural water on Kansas and Missouri agricultural farms, for example, reported seasonal effects on generic E. coli levels (Haley et al., 2022). Similarly, we know that external factors such as temperature, precipitation, humidity all follow somewhat predictable seasonal trends.
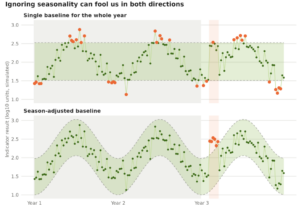
If we build a single baseline across the whole year, the seasonal swing gets mixed into what we call “normal.” In Figure 3 Below, I simulated three years of weekly results with a seasonal pattern. With one baseline for the whole year, the summer highs and winter lows are flagged 17 times in the two baseline years, even though nothing unusual happened. At the same time, a real increase during the seasonal low in year 3 goes unnoticed: only 1 of the 6 affected weeks was flagged. A season-adjusted baseline flagged 0 weeks in the baseline years and 5 of the 6 affected weeks. Same data (different adjustments for a baseline).
What are some limitations
Control charts work best when the baseline comes from a stable period, the samples are representative, and the data behave reasonably well. Microbial data are often skewed, so they usually need a transformation (such as a log) before limits make sense; NIST notes that skewed distributions change the false alarm risk of the usual three-standard-deviation limits. Results below the detection limit need careful handling, and a baseline built from too few samples will give unreliable limits. As I mentioned in my last article a baseline is also only as good as the process it describes, so if past performance was poor, the baseline will reflect that.
And, as with baselines, a signal is not a diagnosis. It tells us that something may have changed, not why, and not that food is necessarily unsafe. The next step is always to verify the data, review the surrounding conditions, and determine whether the result is isolated or part of a larger pattern.
Interested in reading more, here are some resources
Control charts and signal rules
- Nelson LS. 1984. The Shewhart Control Chart: Tests for Special Causes. Journal of Quality Technology 16(4):238-239.